21.2.1. The index of available collections
There are three buttons on the top, that allow to change a panel width which
presents the index. There is a list below the buttons which allows to select
a kind of collection, that we want to see. You can choose current collections, obsolete
collections, that aren't updated or all available collections. There is an option
below the kinds of collections which allows to select if the list shows variables
for a given graph or not. If you select an option to show a list of accessible variables,
for each graph a list with accessible variables, that we want to show on the graph, will
be avaiable.
Below the list, a selection of type devices
is located. Next, the edited field is located, that allows you to
entry a searching string in collections according to criterions
selected above. The items, that are located below, are depended
on a context of work index.
Three work contexts are accessible: browsing, searching
out and an edition of selected data. The browsing is that you
click on links of collection groups (they're often device
equivalents). The searching lets you find needed data quickly.
Passages between modes are very smooth and natural. On each
stage you can select interesting data for you. During different
operations previous selected data will be showed as selected to
show. If you want to see all selected data, you must go to the
edition mode clicking on the button
 .
Newly selected data are remembered during a running search or through pressing any of
four buttons on the bottom toolbar.
.
Newly selected data are remembered during a running search or through pressing any of
four buttons on the bottom toolbar.
21.2.1.1. The toolbar buttons
Meaning of particular buttons is as follows:
21.2.1.2. Displayed data parameters
There are 5 fields allowing you to select what kind of graphs will
be shown (hourly, daily, weekly, monthly or yearly). You can select graph
sizes that will be drown and time, that will be visible in the middle of the graph.
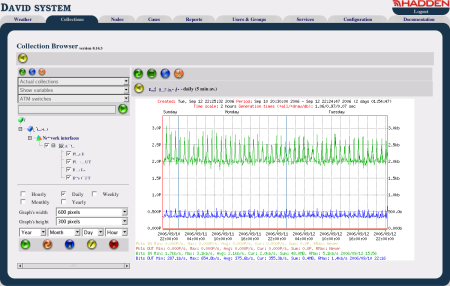
21.2.2. The view of collection graphs
There is a toolbar with buttons relating to all visible graphs
in this part. Meaning of particular buttons is as follows:
Each graphs has additional navigational buttons that let you move after
time scale. The buttons work separately for each graph.