12.6. Description of ping object panels
Each panel of ping objects agrees with groups to which
the objects belong to. A name of the group is the window name.
You can select many objects using the mouse and edit
their properties. Double clicking on an object opens the
edit window.
If you click on the panel outside of any objects with the
mouse, you will unselect all selected objects.
You can move objects between panels (groups) in the easy
way selecting objects and dragging them to a given panel (drag and drop).
Ping objests represent IP addresses, to which ICMP ECHO packets are sent.
The objects can be a result of discovering monitored devices by the system (one
IP address will be choosen from among IP addresses of discovered device), or
it can be created by the user directly.
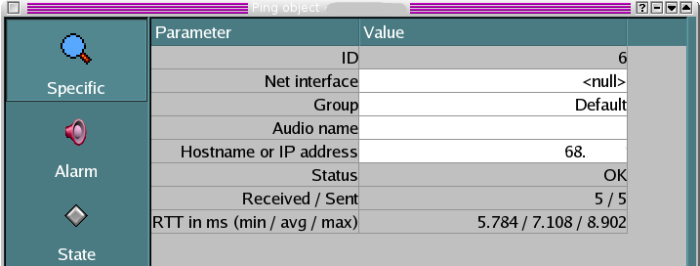
If you click doble on ping object, the dialog window is shown. Specyfic
panel presents basic properities of the object.
Net interface - it shows in which interface of a given device, the object is connected.
The field the most often shows end results of device discovering by the system.
Group - it shows, to which group the object belongs to. Object belonging to the same
group are presented insdie of the same panel. The groups may defines conservation of the objects which
belong to them.
Audio name - it allows to give a string, that is read by a speech synthesizer
when an alarm for the object is run.
Hostname or IP address - it shows IP address, to which ICMP packets are addressed.
Status - it is only to read and it includes information about object status (a percent of
responses/sent packets).
Received/Send - number of received/sent packets.
RTT in ms (min/avg/max) - round trip-time expressed in miliseconds (minimum/average/maximum).
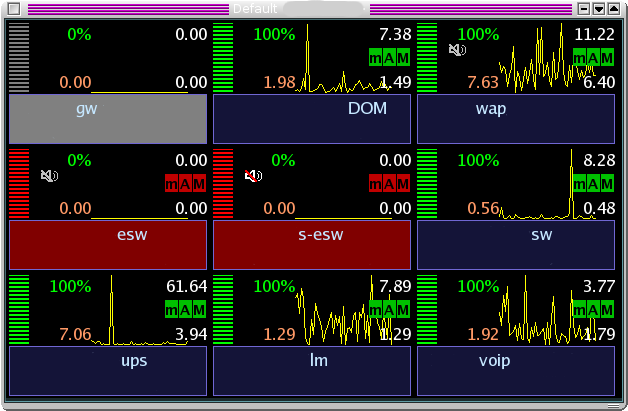
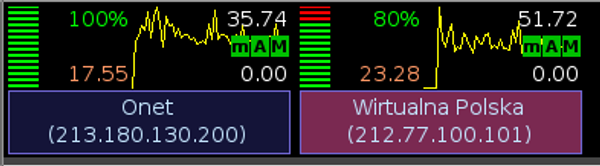
Each ping object is represented by some graphic information about it.
There is a rectangular area in the bottom in which on the top an object name is placed
and below it, in bracket, its IP address. A color of the rectangular area will
change on purpure, when the objcet status is BAD. When the status is DOWN, the color will
change on red and start flashing. When the object has Not managed state, the color will be
gray.
The post from the left side shows a percent number of received responses.
Lacking percent of responses that remains to 100%, is marked as a flashing part of the post.
From the right side of the post is shown a percent of responses numerically in green color.
The rest part of the post is filled by a graph with three numbers describing
it. On the bottom from the left side of the graph, the last middle responding time
of a ping object is placed, and it is counted in milliseconds. The rest two values
written in a white font describes a maximum (at the top) and a minimum (at the bottom)
of the graph. Near the post crossing out symbol
of a loudspeaker can appear. It shows that an alarm is turned off for a given
object. A coloring of the symbol points at a kind of an alarm that was turned off.
There are three letters on the graph from the right side: m, A and M, that
mean (m)Minimum, (A)varage and (M)aximum. They show if limits of response times are
exceeded (red color) or not (green color). The limits are common for the group of
ping object.